Mining / Monero / Observability
How we monitor P2Pool with Grafana
Read P2Pool hashrate, peer connections, sidechain shares and data freshness in Grafana, with real screenshots and a small collector for its local JSON files.
P2Pool monitoring starts with three separate checks: miners are submitting work, the node is connected to its peers and Monero daemon, and the observations are fresh. A running process does not establish all three. Neither does a rising share counter.
This is the shorter companion to our XMRig monitoring series. It reuses that collection and storage setup, then adds P2Pool's file-based API and the graphs we use to interpret it. The screenshots show real recorded data for one selected P2Pool Mini node on November 4, 2026, from 14:00 to 20:00 UTC.
We call the node Pool A in these views. Titles and legends are anonymized, while values and timestamps are unchanged. The panels were arranged in a temporary, read-only Grafana view for this article. No operational dashboard was overwritten. Wallets, peer addresses and individual worker identities are omitted. The paper-collage artwork is illustration, not telemetry.
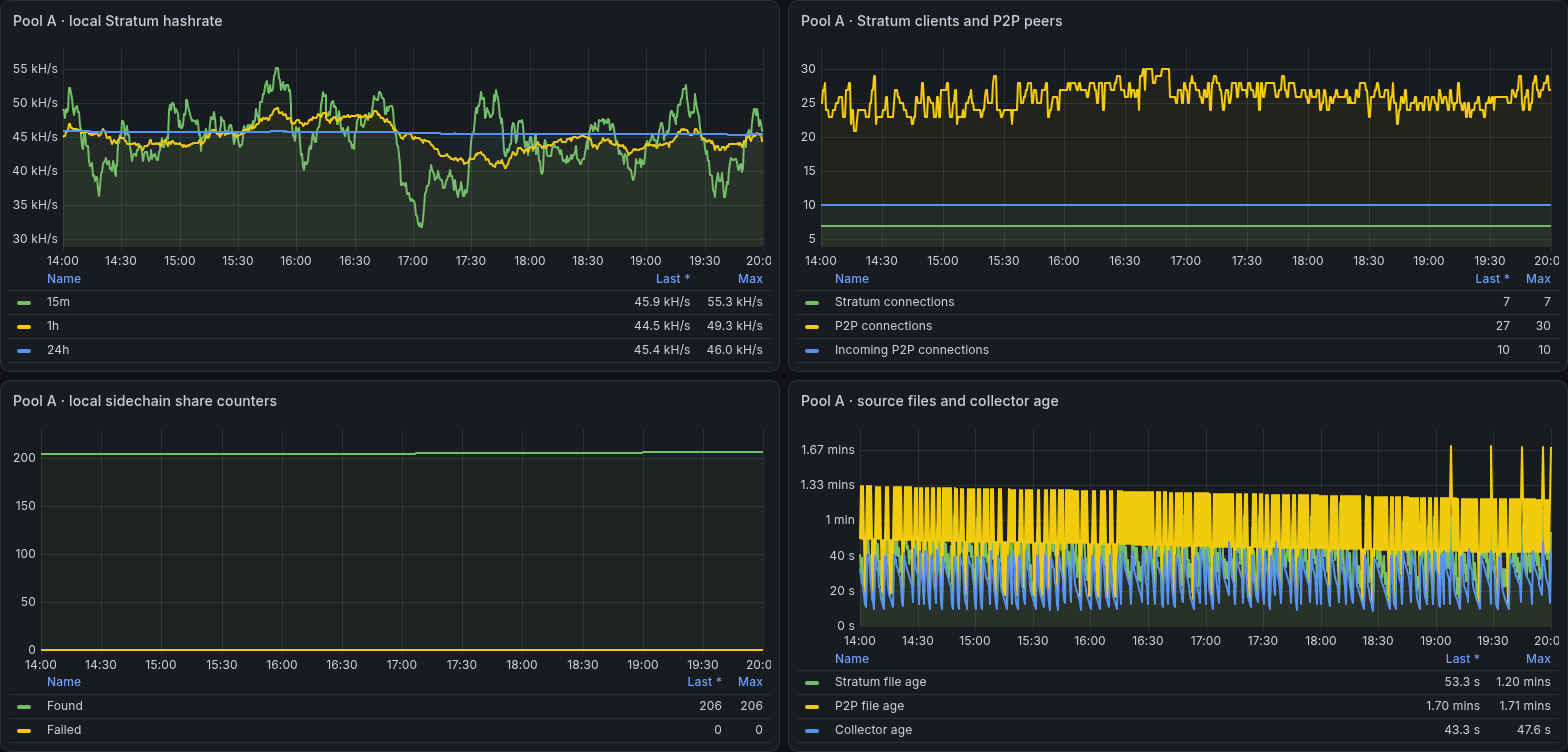
Four views of the same six-hour interval. Each image opens at full resolution. Hashrate, connections, share counters and file age answer different questions.
Reuse the monitoring pipeline
The shared path is already covered in the XMRig article: local collection, an atomic Prometheus textfile, Node Exporter, Alloy, authenticated forwarding and Grafana. P2Pool changes the input to the collector. It does not require another monitoring stack.
| Shared task | Existing instructions |
|---|---|
| Understand the data path | Collection architecture |
| Run a collector and expose its textfile | Service, timer and Node Exporter |
| Forward samples securely | Alloy and authenticated ingestion |
| Configure storage and dashboards | Prometheus and Grafana data sources |
| Collect relevant journal entries | Loki filtering and log redaction |
| Route and test notifications | Alert states and delivery |
Keep the same stable instance label across P2Pool, its host and its logs. The XMRig collector reads an HTTP summary and cannot read P2Pool's JSON files unchanged. Use the small P2Pool collector and service examples supplied with this article for that part.
The example metric names below are its export contract. They differ from our private deployment's names. The screenshots use production data, while the example selects a smaller set of fields for readers to reproduce. Its file-handling tests pass, but the example bundle has not been deployed through a fresh monitoring installation.
Enable P2Pool’s local data files
Add these arguments to the command that already starts P2Pool:
--data-api /var/lib/p2pool/api
--local-api
This is an argument fragment, not a replacement command. Preserve the existing wallet, sidechain, daemon and network settings. The path is an example. P2Pool documents --data-api separately from --data-dir, and --local-api enables the additional local statistics. See the upstream command-line reference.
After a controlled restart, check the files from the account that will collect them. The two inputs used by the example are:
/var/lib/p2pool/api/local/stratum
/var/lib/p2pool/api/local/p2p
These are JSON files, despite having no .json suffix. An external web server is unnecessary when the collector reads them locally. Grant it read access through the service group or a narrow ACL. For containers, provide a read-only mount into the collector's filesystem namespace.
Do not serve the complete local API publicly. Its contents can include wallet, worker and peer information. Our example reads only named numeric fields and leaves everything else out. The bundle's README gives the account, path, service and textfile-directory changes needed to connect it to the shared setup.
Once it is running, start with these Prometheus queries:
p2pool_api_up{endpoint="local/stratum"}
p2pool_hashrate_hps{window="15m"}
p2pool_stratum_connections
A value of 1 for p2pool_api_up means this collector could read and validate the selected file. It does not mean P2Pool is synchronized. Missing optional fields stay absent, and a failed read removes that file's old values from the next exposition. Failure to write the exposition leaves the previous file in place, so monitor the collector timestamp too.
Local hashrate is an estimate from submitted work
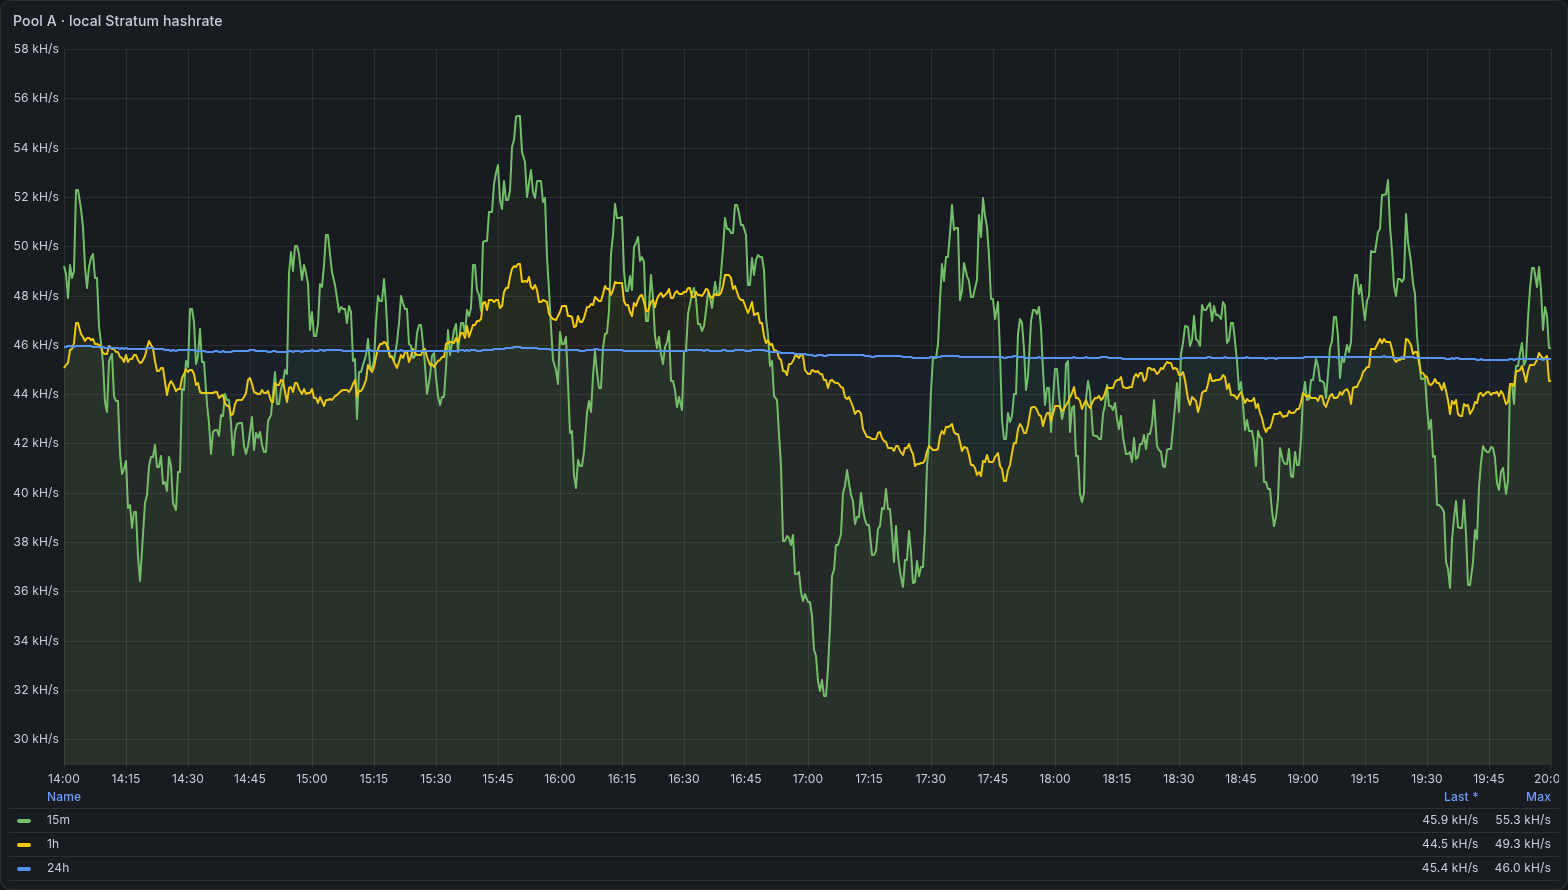
The 15-minute estimate varies much more than the 24-hour estimate. The vertical scale starts around 30 kH/s, not zero. That makes the changes easier to see but visually enlarges their proportion.
P2Pool exposes estimated local hashrate over 15m, 1h and 24h. These windows differ from XMRig's miner-side measurements. Compare the same set of miners and allow for different measurement windows before treating a mismatch as lost work.
In this interval, the short estimate dips near 17:00 while the 24-hour line stays around 45 to 46 kH/s. The graph alone does not identify a failing miner. Check individual XMRig rates, submission activity and logs over the same period. A slower window will also take longer to reflect recovery.
Count client connections and peer connections separately
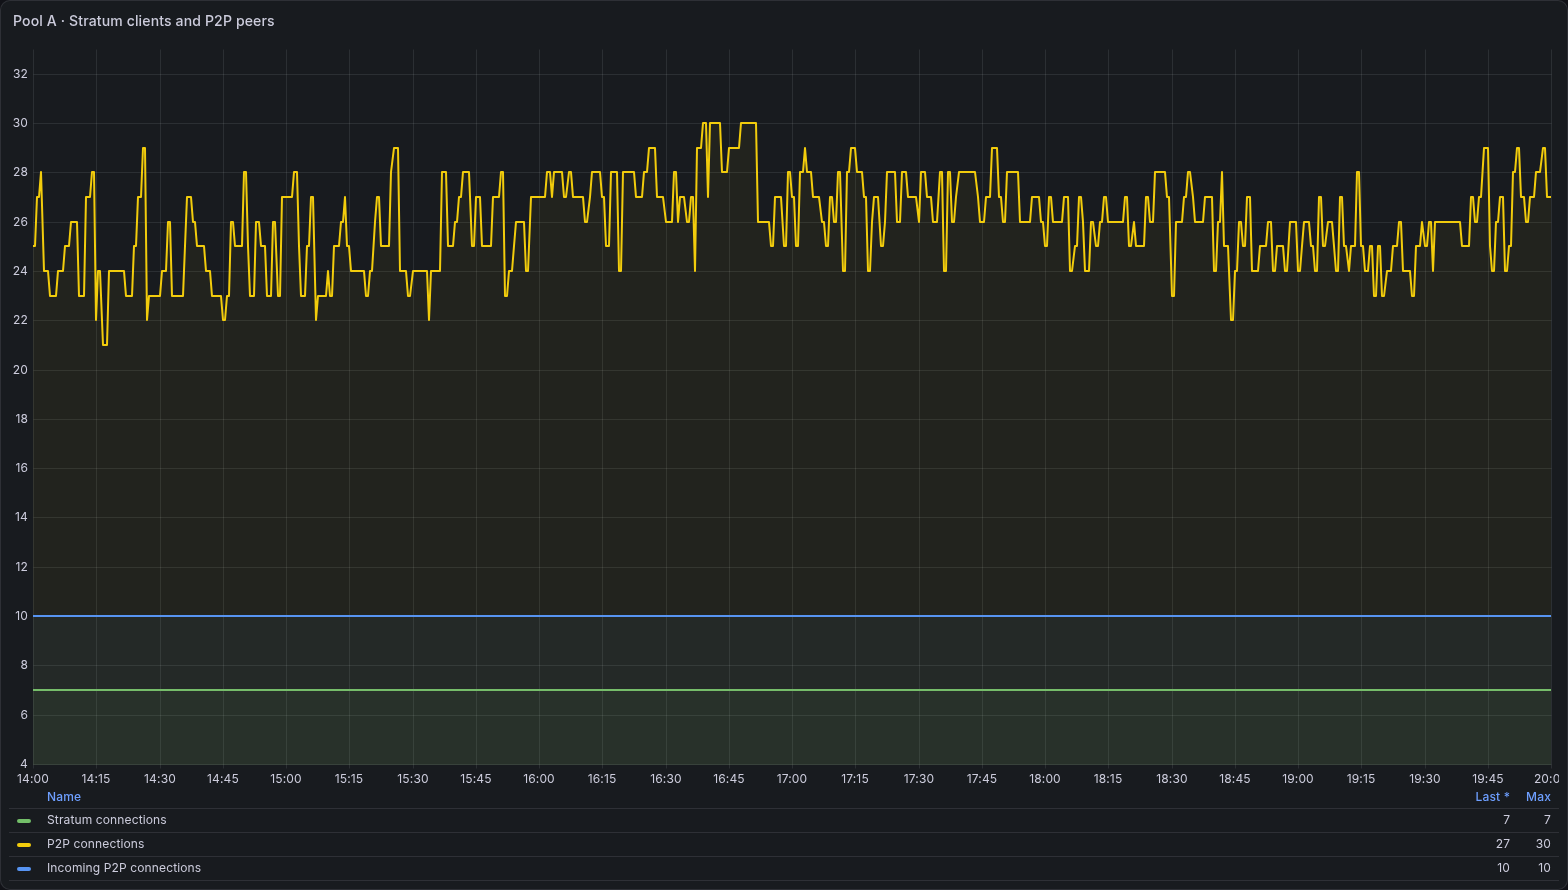
Seven Stratum connections remain present while the total peer count moves between roughly 21 and 30. Incoming peers are included in the total, so do not add those two lines together.
Stratum connections carry mining work. P2P connections link this node to other P2Pool nodes. They are different populations. A stable client count can coexist with a peer-network problem, and a healthy peer count does not prove that miners are submitting useful work.
Proxies and multiple connections prevent a one-to-one mapping between connections and physical miners. Our view shows aggregates rather than worker identities. For a sudden client drop, check the connection path and the rejected-share investigation before changing mining settings.
Separate Stratum submissions from sidechain shares
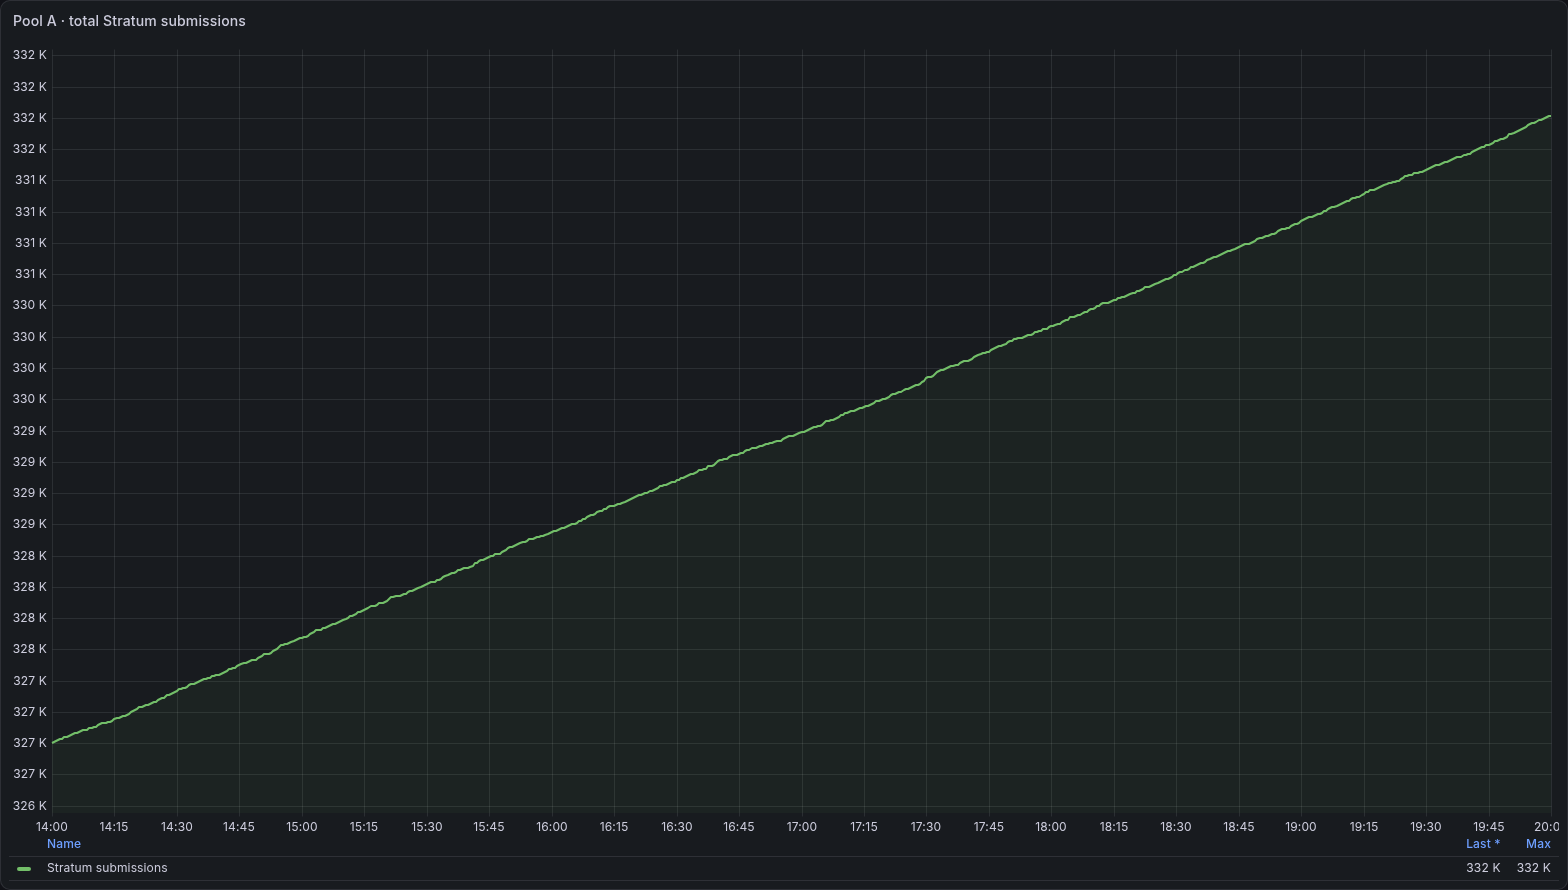
The Stratum counter rises steadily. It describes local submission activity, not a count of Monero blocks or payouts.
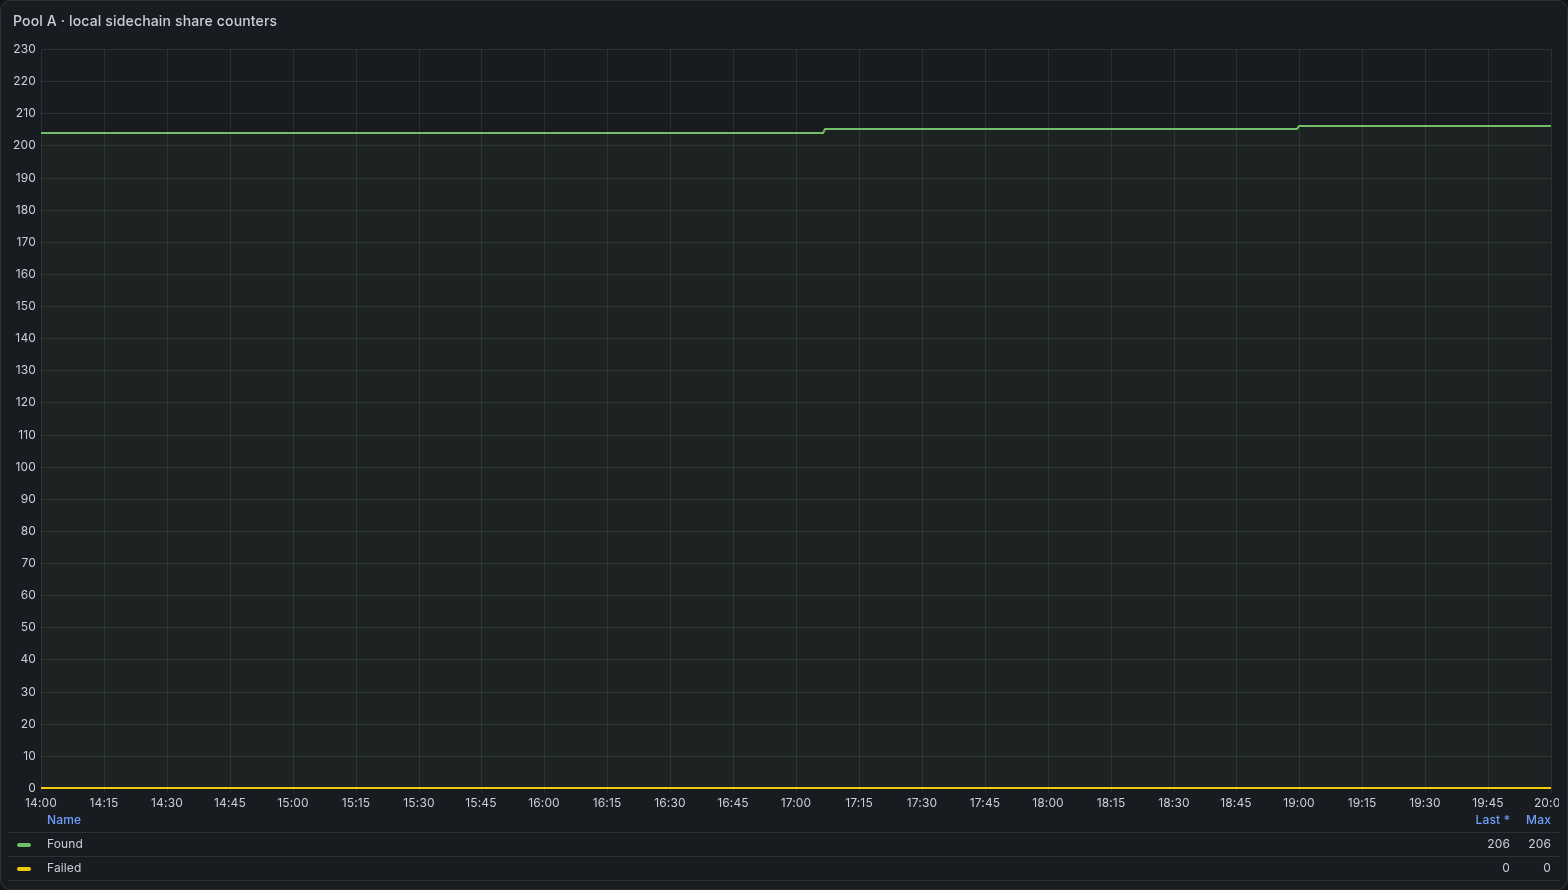
The found counter moves from 204 to 206 during this interval. That is an increase of two, not 206 shares found in six hours. The failed counter stays at zero.
P2Pool's local API separates total_stratum_shares from shares_found and shares_failed. The latter fields concern local sidechain-share handling. The failed field does not count every rejected Stratum submission. Counter resets also matter, including a restart or an explicit share-counter reset. These distinctions follow the Stratum implementation.
For a trend in the example submission counter, use a rate:
rate(p2pool_stratum_shares_total[5m])
Use the miner-side rejection percentage and minimum-volume checks to investigate rejected work. Do not substitute the P2Pool sidechain-failure counter into that calculation.
Effort is not a countdown to a share

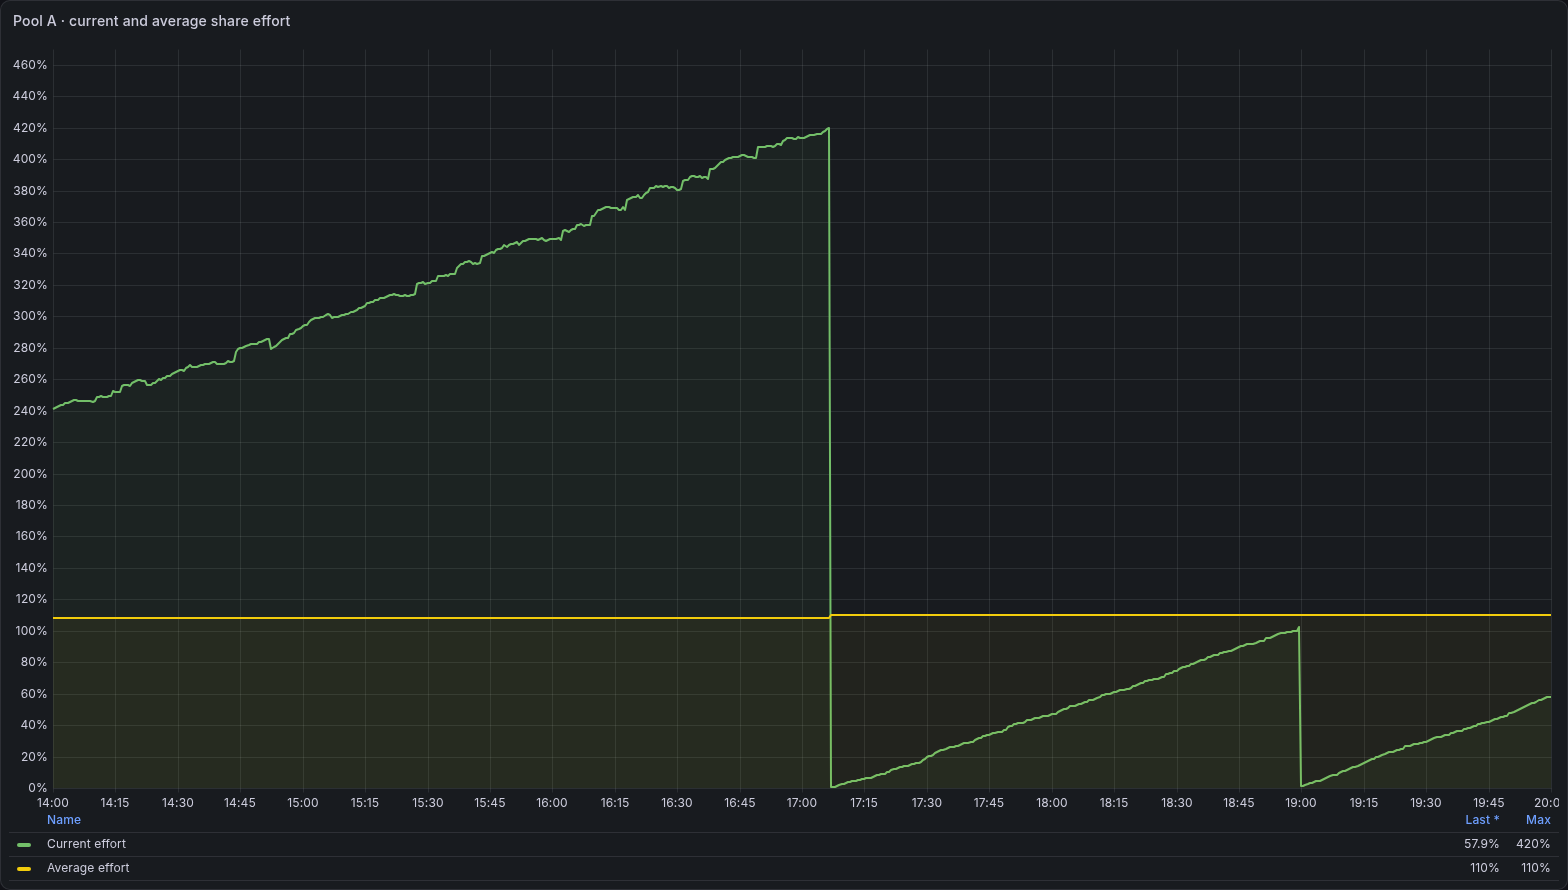
Current effort rises above 400% before dropping near 17:00, then rises and drops again near 19:00. Compare those drops with the increments in the share counter.
Current effort relates accumulated work since the last found sidechain share to current sidechain difficulty. Average effort summarizes completed share history using accumulated difficulty. Neither percentage promises when the next share will arrive. Passing 100% is not, by itself, a reason to restart P2Pool.
Payouts require a separate interpretation. Sidechain shares participate in the payout window, and a Monero block found by that P2Pool sidechain produces the corresponding payouts. Finding a local sidechain share is not the same event as receiving a payout. Use P2Pool's payout documentation and the XMRig guide's payout distinction when naming panels or notifications.
Check file freshness and the Monero connection
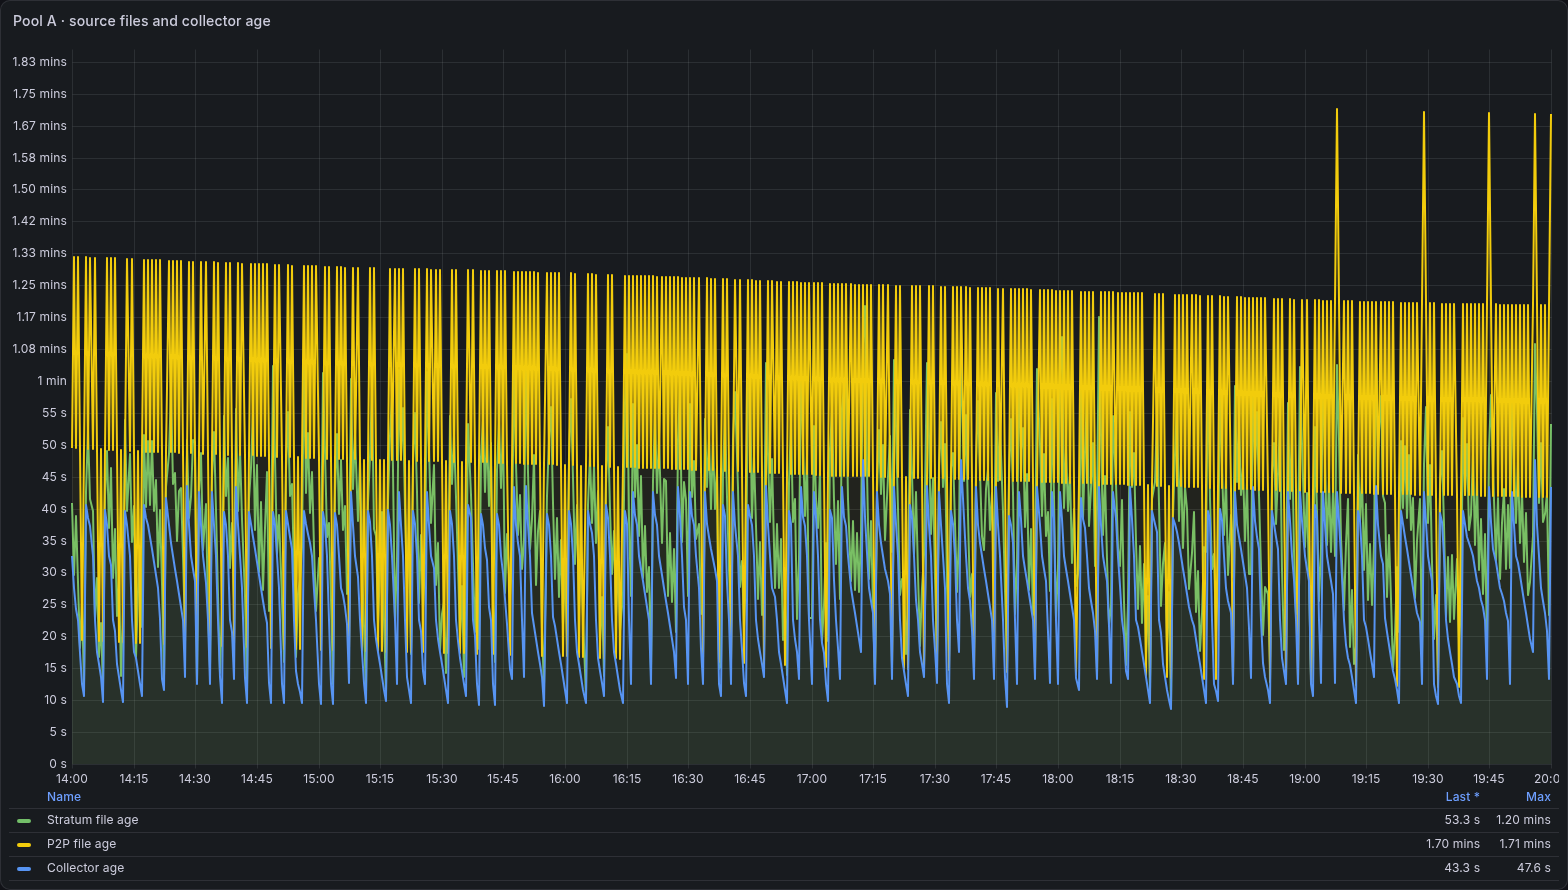
The collector, Stratum file and P2P file have different update patterns. Grafana displays the longer durations in minutes even though the queries return seconds.
With the example exporter, graph the Stratum file's age:
time() - p2pool_api_timestamp_seconds{endpoint="local/stratum"}
Also graph time() - p2pool_collector_timestamp_seconds. A collector can keep running while reading an old source file. Conversely, Node Exporter can keep serving an old textfile after the collector stops. The two ages help locate the break.
File modification time records the last content change. P2Pool avoids rewriting identical API content. Age is therefore a diagnostic signal rather than a universal heartbeat. Interpret it alongside read status, expected activity and other fields. Synchronize host clocks before comparing timestamps.
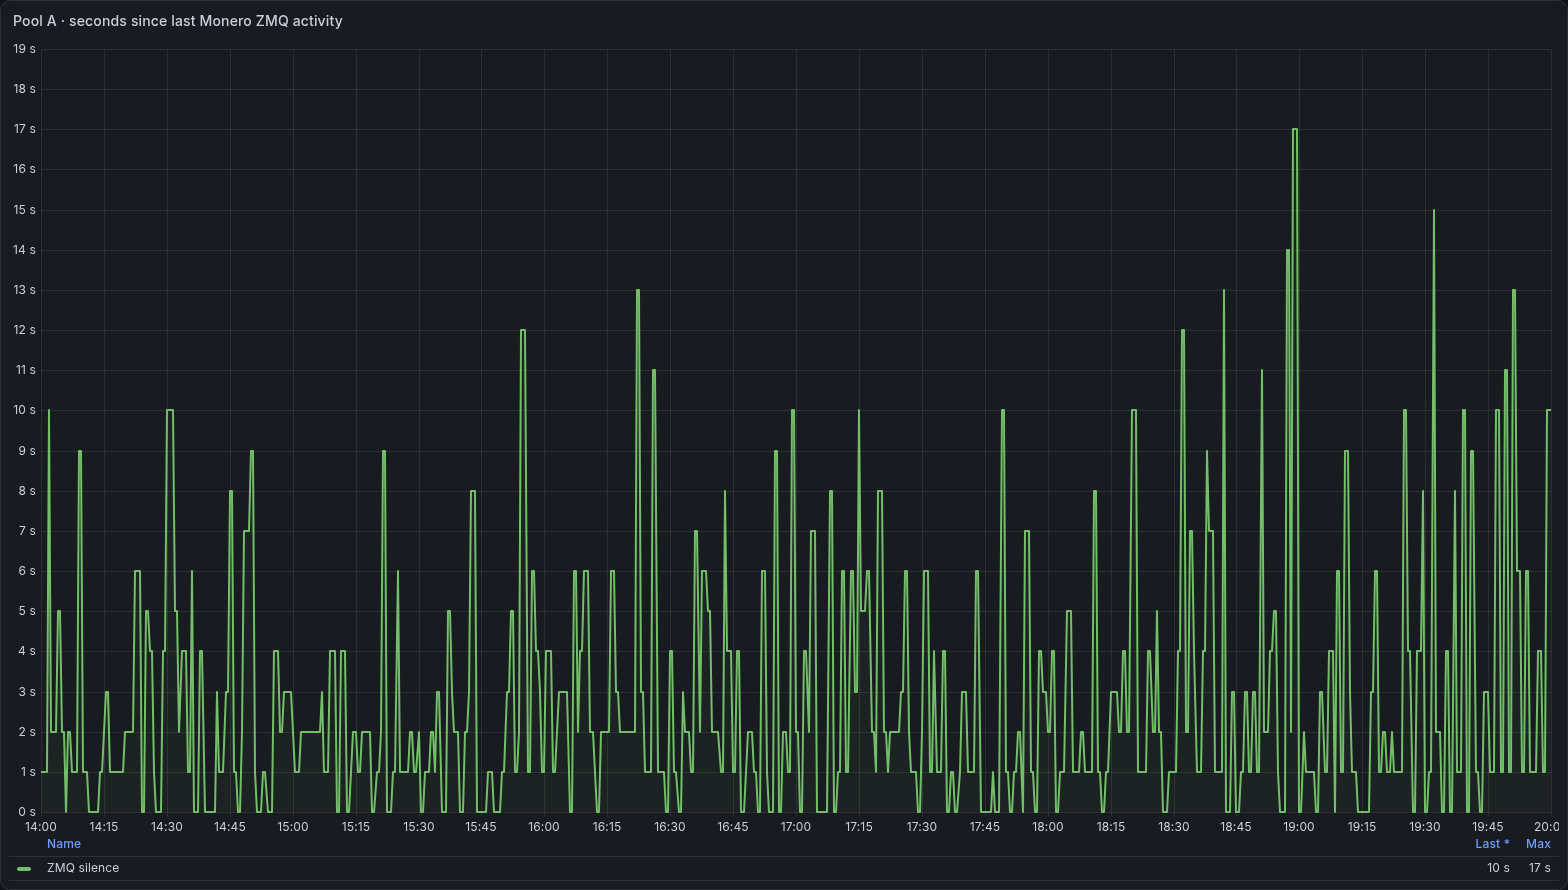
The sampled ZMQ-silence values remain below 20 seconds here. This measures time since observed daemon activity, not peer latency.
The local/p2p field zmq_last_active already contains elapsed seconds. Do not subtract it from time(). Our example exports it as p2pool_zmq_silence_seconds. Check it together with Monero RPC availability, synchronization and advancing chain height. The P2P implementation describes the daemon-activity check.
Alert on loss of service, not ordinary luck
Start with a few conditions whose response is clear:
| Condition | First action |
|---|---|
| Collector output disappears or keeps aging | Check the timer, write permissions and forwarding path |
| A local API read fails | Check file existence, permissions and JSON compatibility |
| Expected miners disconnect or submission rate stops | Check miners, Stratum reachability and logs |
| Peer connectivity disappears or daemon activity stays silent | Check P2Pool networking and the Monero daemon |
| Source-file age rises far beyond its usual pattern | Compare collector age, read status and whether the underlying data should be changing |
Use pending durations that tolerate normal collection delays. Add expected-node inventory on the monitoring side so a vanished node does not disappear from its own alert selector. The existing alerting section covers missing versus stale data and notification testing.
For logs, adapt the Loki journal filter to the actual P2Pool service name. Inspect reconnects, rejected work and share events around the metric change. Redact addresses before sharing entries, and test each payout or block-event parser against the wording your installed version emits.
Before relying on this addition, run the bundle's collector tests and follow the pipeline validation sequence. Test an unreadable file and an invalid JSON document on staging, then confirm that the corresponding API status becomes zero while the collector still reports its own timestamp. A high-effort interval with fresh data and continuing submissions calls for a different response from a stopped collector.