Mining / Monero / Observability
XMRig monitoring, part 1: collect and store metrics
Set up XMRig monitoring with a local API collector, Node Exporter, Alloy, Prometheus and Grafana. Part 1 includes configuration examples and a tested bundle.

XMRig monitoring series
Our XMRig monitoring setup collects miner statistics locally, stores time series in Prometheus, sends selected logs to Loki, and puts both in Grafana. The useful question is whether a miner is producing accepted work with fresh telemetry. A running process and a plausible hashrate do not answer that on their own.
We use the same dashboard to move from a symptom to a narrower question. Did the hashrate fall? Did the pool start rejecting work? Did another process consume CPU time? Did the miner stop reporting, or did its monitoring agent stop forwarding data?
Part 1 of this series builds the collection path we inspected in our running setup, using a smaller Linux example that readers can adapt. Our production collector covers additional services and hardware. The example below handles one XMRig process, with a consistent metric schema and explicit failure signals.
Download the example configuration bundle for the collector, service units, alert rules, generic Grafana dashboard and validation fixtures. The examples passed collector tests, alert scenarios and configuration syntax checks. They have not been deployed end to end on a fresh host. Adapt credentials, networking and notification delivery to your installation.
The dashboard images are real Grafana captures from November 4, 2026. They show one selected miner from 14:00 to 20:00 UTC, including a closer view from 15:45 to 16:15 UTC. Its visible name has been replaced with Miner A, and surrounding navigation has been cropped. The plotted values, axes, time range and units have not been rewritten. These views do not show our full inventory. The cream and orange artwork is illustration, not telemetry.
What the dashboard tells us
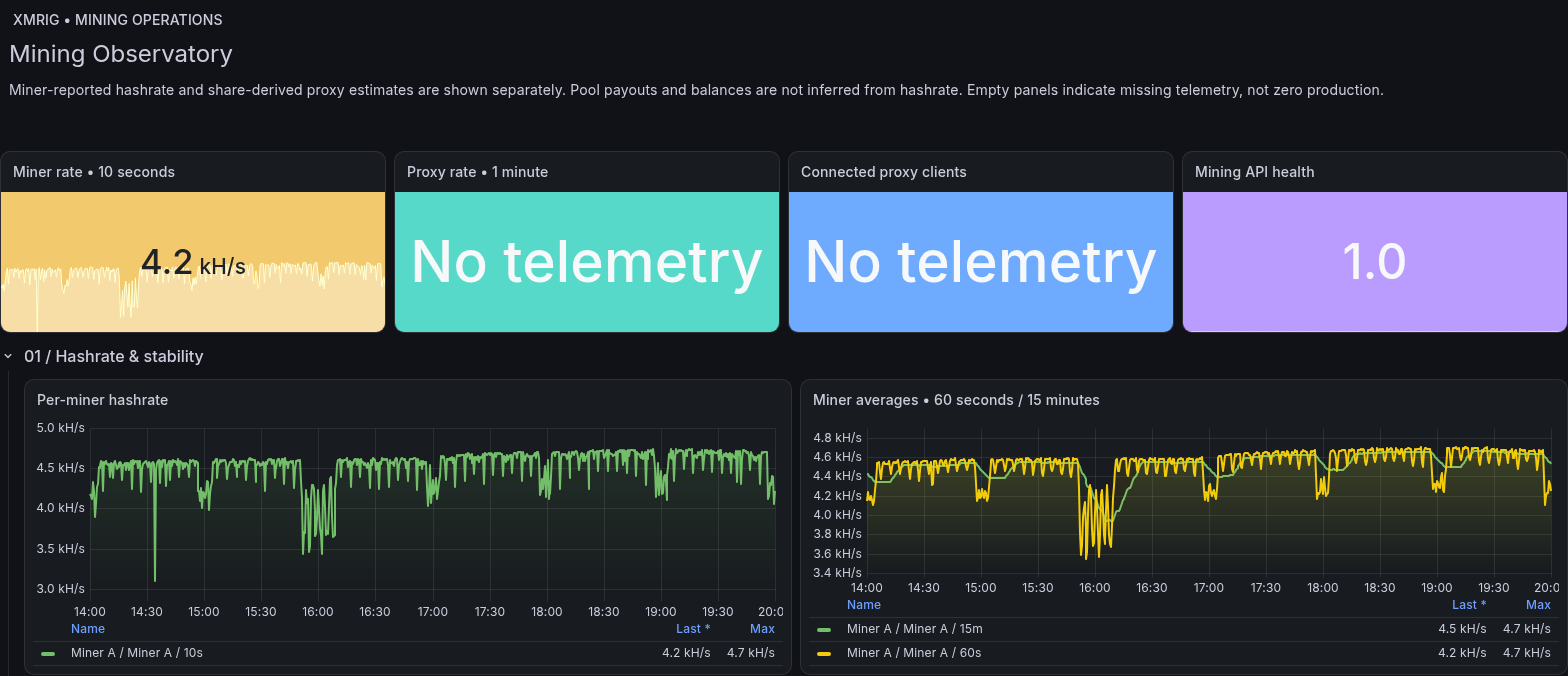
The upper portion of our XMRig dashboard, filtered to one miner. Proxy panels show “No telemetry” because this selection is a miner rather than a proxy. Missing proxy data here is not evidence of a proxy outage.
We arrange the XMRig view around four questions.
| Question | Signals we inspect | What the signals cannot establish alone |
|---|---|---|
| Is the miner reporting useful work? | API availability, hashrate windows, process uptime, accepted-share rate | Actual pool payouts or profit |
| Is its pool connection working? | Rejected work, connection state, reported latency, share difficulty | The cause of every rejection or timeout |
| Is the host constraining it? | CPU use, temperature sensors, memory, per-thread rate, huge-page coverage where available | Wall power or a hardware diagnosis without supporting evidence |
| Can we trust the observation? | Collector age, scrape success, agent health, ingestion and notification health | Availability during failure of the monitoring system itself |
The first row is deliberately small. Detailed panels remain available for investigation, but the first screen should show whether the selected miner is reporting, how its rate is moving, and which measurements are absent.
An API value of 1 means the collector completed the expected request and parsing. Recent accepted work needs a separate check. A smoothly rising uptime measures process continuity, while connection statistics describe its relationship with the pool.
The collection path
On the inspected miner, a systemd timer invokes a local collector roughly every 15 seconds. It reads XMRig's loopback HTTP API and writes numeric metrics to a textfile directory. Node Exporter exposes those metrics together with host statistics. Alloy scrapes the local exporter every 30 seconds and sends the samples to central Prometheus through authenticated TLS. A separate Alloy pipeline reads logs and forwards them to Loki. Grafana queries those stores.
Miner host
  XMRig HTTP API on loopback
    -> local collector
    -> atomic .prom file
    -> Node Exporter on loopback
    -> Alloy scrape
    -> authenticated TLS -> Prometheus -> Grafana

  Selected systemd journal entries
    -> Alloy filtering and redaction
    -> authenticated TLS -> Loki -> Grafana

  Prometheus alert rules
    -> Alertmanager -> a tested notification receiver
The textfile between the collector and exporter matters. If a collection run fails halfway through writing, readers should still see either the complete previous file or the complete replacement. If the collector stops entirely, however, Node Exporter can continue serving the old file. That is why we monitor the collection timestamp as well as scrape success.
Our deployed metric names carry a site-specific prefix. The tutorial uses xmrig_ for miner values and mining_ for collector health. These names are an example exporter contract, not built-in Prometheus output from XMRig. Copying a query without matching the exporter schema is a common reason for an empty panel.

Prepare a small installation first
The worked example assumes a Linux host using systemd, an existing working XMRig installation, and a monitoring server reachable over a private network or authenticated gateway. It does not change the mining algorithm, wallet, pool destination, thread count or donation settings.
Install Python 3 on the miner. Install a verified Node Exporter release and put its binary at /usr/local/bin/node_exporter, or adapt the service to your distribution's package. Install Alloy using the official Linux installation instructions. The example assumes its service account is named alloy.
On the monitoring server, install Prometheus, Grafana, Loki, and Alertmanager. Use supported releases, verify their distribution artifacts, and record the versions or container digests you installed. The configurations here assume all four backends run on the same server. Container installations need service DNS names in place of host loopback addresses.
Build the path for one miner before adding more. A working local API request, a fresh textfile, and one queryable series make later failures much easier to locate.
Enable XMRig's local HTTP API
Merge the following objects into the existing XMRig JSON configuration. This is a fragment, not a replacement mining configuration.
{
  "api": {
    "id": "miner-a",
    "worker-id": "miner-a"
  },
  "http": {
    "enabled": true,
    "host": "127.0.0.1",
    "port": 18088,
    "access-token": "REPLACE_WITH_A_RANDOM_LOCAL_TOKEN",
    "restricted": true
  }
}
Choose an unused port and a random token. Port 18088 is a tutorial value. A fixed port lets the collector find the API after a restart. An explicit worker identifier avoids relying on a hostname-derived default. Keep restricted mode enabled for this read-only monitoring task. XMRig documents these settings in its API configuration reference.
Back up the existing configuration, validate its JSON, and arrange a controlled XMRig restart using the service manager that already owns the process. Keep the configuration file readable only by the accounts that need it. Do not copy it into a dashboard or paste its complete contents into a support ticket.
Create a separate collector account and directory. On a fresh host, the following commands establish the example paths. If either service account already exists, reuse it instead of running its creation command again.
sudo useradd --system --no-create-home --shell /usr/sbin/nologin xmrig-monitor
sudo useradd --system --no-create-home --shell /usr/sbin/nologin node-exporter
sudo install -d -o root -g xmrig-monitor -m 0750 /etc/xmrig-monitor
sudo install -d -o xmrig-monitor -g xmrig-monitor -m 0755 /var/lib/xmrig-monitor/textfile
sudo install -d -o root -g root -m 0755 /usr/local/lib/xmrig-monitor
Store the same API token in /etc/xmrig-monitor/api-token. Set its owner to root, group to xmrig-monitor, and permissions to 0640. Use a protected editor or your secret manager. The collector needs this token, not the rest of the mining configuration.
Test the API without putting the token in a command-line argument:
sudo -u xmrig-monitor python3 - <<'PY'
import json
from pathlib import Path
import urllib.request

token = Path('/etc/xmrig-monitor/api-token').read_text().strip()
request = urllib.request.Request(
    'http://127.0.0.1:18088/2/summary',
    headers={'Authorization': 'Bearer ' + token}
)
with urllib.request.urlopen(request, timeout=4) as response:
    data = json.load(response)
print({
    'uptime_seconds': data.get('uptime'),
    'hashrate_windows': data.get('hashrate', {}).get('total'),
    'accepted': data.get('results', {}).get('shares_good')
})
PY
This prints only selected fields. An authentication error points to the token or API configuration. Connection refusal points to the listener, port or process. A JSON response with a different structure requires an exporter adjustment. Do not solve an authentication problem by binding the API to every interface.
Loopback binding applies within a network namespace. If XMRig runs inside a container, a collector on the host cannot automatically reach that container's loopback listener. Place the collector in the same namespace or design an authenticated, narrowly scoped connection between them. Do not assume 127.0.0.1 means the same process environment on both sides.
Export a small, explicit set of metrics
XMRig's summary exposes hashrate windows, uptime and share counters. In the upstream implementation, shares_good counts accepted results and shares_total counts accepted plus rejected results. The example maps these to named Prometheus counters and excludes identifying fields and raw API responses. See XMRig's network-state implementation for the counter definitions.
| Example metric | Type | Interpretation |
|---|---|---|
xmrig_api_up |
Gauge | The collector obtained and parsed a usable summary |
xmrig_hashrate_hps{window="60s"} |
Gauge | Miner-reported hashes per second for that window |
xmrig_accepted_shares_total |
Counter | Accepted results reported by this process |
xmrig_submitted_shares_total |
Counter | Accepted plus rejected results |
xmrig_uptime_seconds |
Gauge | XMRig process uptime |
xmrig_pool_latency_milliseconds |
Gauge | XMRig's reported result latency field |
xmrig_share_difficulty |
Gauge | Current share difficulty reported by XMRig |
mining_collector_timestamp_seconds |
Gauge | Time this collection attempt produced its output |
mining_collector_duration_seconds |
Gauge | Time spent on the attempt |
Save this collector as /usr/local/lib/xmrig-monitor/xmrig-collector.py. It uses only the Python standard library.
#!/usr/bin/env python3
"""Example single-miner collector. Numeric allowlist only. Python standard library."""
import json
import math
import os
from pathlib import Path
import tempfile
import time
import urllib.request


def finite(value):
    return isinstance(value, (int, float)) and not isinstance(value, bool) and math.isfinite(value)


def collect(url, token):
    started = time.monotonic()
    lines = []

    def emit(name, kind, value, labels=""):
        if finite(value):
            if not any(line.startswith("# TYPE " + name + " ") for line in lines):
                lines.append(f"# TYPE {name} {kind}")
            lines.append(f"{name}{labels} {value}")

    ok = 0
    try:
        request = urllib.request.Request(url, headers={"Authorization": "Bearer " + token})
        with urllib.request.urlopen(request, timeout=4) as response:
            data = json.load(response)
        rates = data["hashrate"]["total"]
        results = data["results"]
        good, total = results["shares_good"], results["shares_total"]
        uptime = data["uptime"]
        if not isinstance(rates, list) or len(rates) != 3:
            raise ValueError("Unexpected hashrate windows")
        if not all(finite(v) and v >= 0 for v in (good, total, uptime)) or good > total:
            raise ValueError("Invalid counters")
        if any(v is not None and (not finite(v) or v < 0) for v in rates):
            raise ValueError("Invalid hashrate")
        for window, value in zip(("10s", "60s", "15m"), rates):
            emit("xmrig_hashrate_hps", "gauge", value, '{window="' + window + '"}')
        emit("xmrig_accepted_shares_total", "counter", good)
        emit("xmrig_submitted_shares_total", "counter", total)
        emit("xmrig_uptime_seconds", "gauge", uptime)
        emit("xmrig_pool_latency_milliseconds", "gauge", results.get("latency"))
        emit("xmrig_share_difficulty", "gauge", results.get("diff_current"))
        ok = 1
    except Exception:
        # Do not put response bodies, pool addresses or tokens into logs.
        lines = []
    emit("xmrig_api_up", "gauge", ok)
    emit("mining_collector_timestamp_seconds", "gauge", time.time())
    emit("mining_collector_duration_seconds", "gauge", time.monotonic() - started)
    return "\n".join(lines) + "\n"


def main():
    directory = Path(os.environ.get("METRICS_DIR", "/var/lib/xmrig-monitor/textfile"))
    token_path = Path(os.environ.get("TOKEN_FILE", "/etc/xmrig-monitor/api-token"))
    url = os.environ.get("XMRIG_SUMMARY_URL", "http://127.0.0.1:18088/2/summary")
    # Failure to read credentials or publish a file leaves freshness to detect it.
    token = token_path.read_text().strip()
    text = collect(url, token)
    descriptor, name = tempfile.mkstemp(prefix=".xmrig-", suffix=".tmp", dir=directory)
    try:
        with os.fdopen(descriptor, "w") as output:
            output.write(text)
            output.flush()
            os.fsync(output.fileno())
        os.chmod(name, 0o644)
        os.replace(name, directory / "xmrig.prom")
    finally:
        if os.path.exists(name):
            os.unlink(name)


if __name__ == "__main__":
    main()
The script has several intentional failure behaviours. A successful request with unavailable hashrate windows leaves those samples absent, preserving the distinction between startup and zero production. An API or parsing failure writes xmrig_api_up 0 and removes the old miner values from the replacement file. A token-file or filesystem failure prevents publication of a replacement, so the previous timestamp ages and the systemd unit records an error.
The script validates the fields it depends on before calling the response usable. Adapt that validation when changing XMRig versions or using a different API. It handles an XMRig miner, not XMRig Proxy. A proxy's hashrate windows and result fields need their own mapping.
The temporary file ends in .tmp, and the final rename happens within the destination directory. Node Exporter's textfile collector reads files ending in .prom without supporting sample timestamps. The collection timestamp above is therefore an ordinary metric value, not a third column appended to every sample.
Run the collector and Node Exporter
Save the collector service as /etc/systemd/system/xmrig-monitor.service:
[Unit]
Description=Collect local XMRig metrics
After=network.target

[Service]
Type=oneshot
User=xmrig-monitor
Group=xmrig-monitor
ExecStart=/usr/bin/python3 /usr/local/lib/xmrig-monitor/xmrig-collector.py
TimeoutStartSec=10
NoNewPrivileges=true
PrivateTmp=true
ProtectSystem=strict
ProtectHome=true
ReadWritePaths=/var/lib/xmrig-monitor/textfile
UMask=0022
Save its timer as /etc/systemd/system/xmrig-monitor.timer:
[Unit]
Description=Collect XMRig metrics every 15 seconds

[Timer]
OnBootSec=15s
OnUnitActiveSec=15s
AccuracySec=1s

[Install]
WantedBy=timers.target
The service runs as the dedicated account and can write only to its metrics directory under the filesystem restrictions shown. The timer's interval is a scheduling target, not a guarantee of exact 15-second spacing. Watch the output timestamp rather than inferring freshness from the intended schedule.
Save this exporter unit as /etc/systemd/system/node-exporter.service:
[Unit]
Description=Local host and mining metrics
After=network.target

[Service]
User=node-exporter
Group=node-exporter
ExecStart=/usr/local/bin/node_exporter --web.listen-address=127.0.0.1:9100 --collector.textfile.directory=/var/lib/xmrig-monitor/textfile
Restart=on-failure
NoNewPrivileges=true

[Install]
WantedBy=multi-user.target
This is for a fresh installation. If a packaged Node Exporter is already running, configure its existing unit with the same listener and textfile directory instead of starting a second process on the port.
Load the units and make the first collection:
sudo systemctl daemon-reload
sudo systemctl start xmrig-monitor.service
sudo systemctl enable --now xmrig-monitor.timer node-exporter.service
sudo systemctl status xmrig-monitor.service xmrig-monitor.timer
curl --fail --silent http://127.0.0.1:9100/metrics > /tmp/mining-metrics.txt
grep -E '^(xmrig_|mining_collector_|node_textfile_scrape_error)' /tmp/mining-metrics.txt
A completed one-shot service can be inactive after a successful run. Check its exit status, the active timer and the file timestamp together. The metrics response should contain the miner fields, a recent collection time and node_textfile_scrape_error 0. A parse error here is an exporter problem, even if the API request worked.
The exporter listens only on loopback because Alloy scrapes it locally. If you choose central Prometheus scraping instead, use a private authenticated route to the exporter and adjust the topology deliberately. Do not configure both paths to ingest the same series under different job labels and then sum both copies.
Forward metrics with Alloy
This is the metrics portion of /etc/alloy/config.alloy:
logging {
  level = "warn"
}

prometheus.scrape "miner" {
  targets = [{"__address__" = "127.0.0.1:9100", "instance" = "miner-a"}]
  job_name = "mining-hosts"
  scrape_interval = "30s"
  forward_to = [prometheus.remote_write.central.receiver]
}

prometheus.scrape "agent" {
  targets = [{"__address__" = "127.0.0.1:12345", "instance" = "miner-a"}]
  job_name = "alloy"
  scrape_interval = "30s"
  forward_to = [prometheus.remote_write.central.receiver]
}

prometheus.remote_write "central" {
  endpoint {
    url = "https://metrics.example.net/api/v1/write"
    tls_config {
      ca_file = "/etc/alloy/telemetry/ca.crt"
      cert_file = "/etc/alloy/telemetry/client.crt"
      key_file = "/etc/alloy/telemetry/client.key"
    }
  }
}
Replace miner-a with a stable identifier you control. Use the same identifier for host metrics, miner metrics and logs. If one host runs multiple miners, add a separate miner label to the collector output and adjust alert joins to include it. The single-miner example intentionally avoids that extra dimension.
metrics.example.net is a placeholder. Provision a server certificate whose identity matches your chosen endpoint, a trusted CA file, and a distinct client certificate and key for each agent. The Alloy account must be able to read its key, while unrelated users must not. Keep its HTTP management listener on loopback and give it a persistent storage directory.
Alloy's remote-write component writes incoming samples to a write-ahead log before forwarding them. That provides buffering during interruptions, subject to its configured retention and available disk space. A backlog can still become data loss. Monitor retries, failed sends, queue behaviour and the disk that holds the WAL.
At the gateway, accept authenticated agent traffic only on the intended ingestion routes. Our design separates ingestion from the Grafana login and other administrative interfaces. For this example, the gateway needs these two mappings:
| Authenticated route | Backend on the monitoring server |
|---|---|
POST /api/v1/write |
Prometheus on 127.0.0.1:9090 |
POST /loki/api/v1/push |
Loki on 127.0.0.1:3100 |
Reject unrecognized routes and clients without valid certificates. Keep backend listeners private. A certificate authenticates a sending agent, but it does not by itself ensure the agent can only send an approved instance label. If that distinction matters to your threat model, enforce identity-to-label rules at a suitable ingestion layer rather than trusting labels supplied by the client.
Validate the Alloy file before restarting its service:
sudo alloy validate /etc/alloy/config.alloy
sudo systemctl restart alloy
sudo journalctl -u alloy -n 80 --no-pager
Use the actual binary and service names from your installation. A syntactically valid file still needs readable credentials, a trusted server certificate, a reachable endpoint and a receiver that accepts the write protocol.
Configure the central metrics store and Grafana
Prometheus needs its remote-write receiver enabled for this topology. Add the following arguments to the service or container command that starts it:
--config.file=/etc/prometheus/prometheus.yml
--storage.tsdb.path=/var/lib/prometheus
--web.listen-address=127.0.0.1:9090
--web.enable-remote-write-receiver
--storage.tsdb.retention.time=30d
--storage.tsdb.retention.size=25GB
The retention values are example limits. Choose them against your sample volume and free space. A time limit and size limit are both constraints, so the size limit can shorten the available history. Leave headroom for the database and WAL instead of assigning the entire disk to retained blocks. The Prometheus storage guide explains the retention behaviour.
Use this configuration, with the alert rules from Part 3 saved under the referenced path:
global:
  scrape_interval: 30s
  evaluation_interval: 30s
rule_files:
  - /etc/prometheus/mining-rules.yml
scrape_configs:
  - job_name: prometheus
    static_configs:
      - targets: ['127.0.0.1:9090']
alerting:
  alertmanagers:
    - static_configs:
        - targets: ['127.0.0.1:9093']
The server scrapes itself. Miner and agent samples arrive through remote write, so they do not need a second central scrape job. The up series with job="mining-hosts" describes Alloy's local scrape of Node Exporter. It is not a direct central-server reachability probe.
Provision the Grafana data sources through a file in its provisioning/datasources directory:
apiVersion: 1
datasources:
  - name: Prometheus
    uid: prometheus
    type: prometheus
    access: proxy
    url: http://127.0.0.1:9090
    isDefault: true
    jsonData:
      timeInterval: 30s
  - name: Loki
    uid: loki
    type: loki
    access: proxy
    url: http://127.0.0.1:3100
These loopback URLs assume Grafana shares the host network namespace with the backends. In separate containers, use the corresponding private service addresses. Keep Grafana authenticated and disable anonymous access for operational dashboards. Verify each data source with Grafana's connection test and an actual query.
Start with xmrig_api_up, then xmrig_hashrate_hps{window="60s"}, then the timestamp-age query in Part 2. If those return data, add panels. A complex dashboard is a poor first test of an ingestion pipeline.
The accompanying configuration bundle includes xmrig-dashboard.json, a generic dashboard for the tutorial metric names. Import it through Grafana's dashboard import screen after provisioning the prometheus and loki data-source UIDs. Its selector uses the expected-miner records defined in Part 3. It is separate from the private dashboards in the screenshots and includes no production labels or endpoints. Grafana describes the upload flow in its dashboard import documentation.
Next: Part 2, read the dashboards
The collection path is in place. Next, follow one miner through the real Grafana screenshots: compare hashrate windows, separate accepted work from submitted results, and check whether the data is fresh enough to trust.