Mining / Monero / P2Pool
How we pull P2Pool statistics into our dashboard
Inside our P2Pool dashboard: nine observer API feeds, private SSH transport, cached statistics, exact payout validation and stale-data checks.
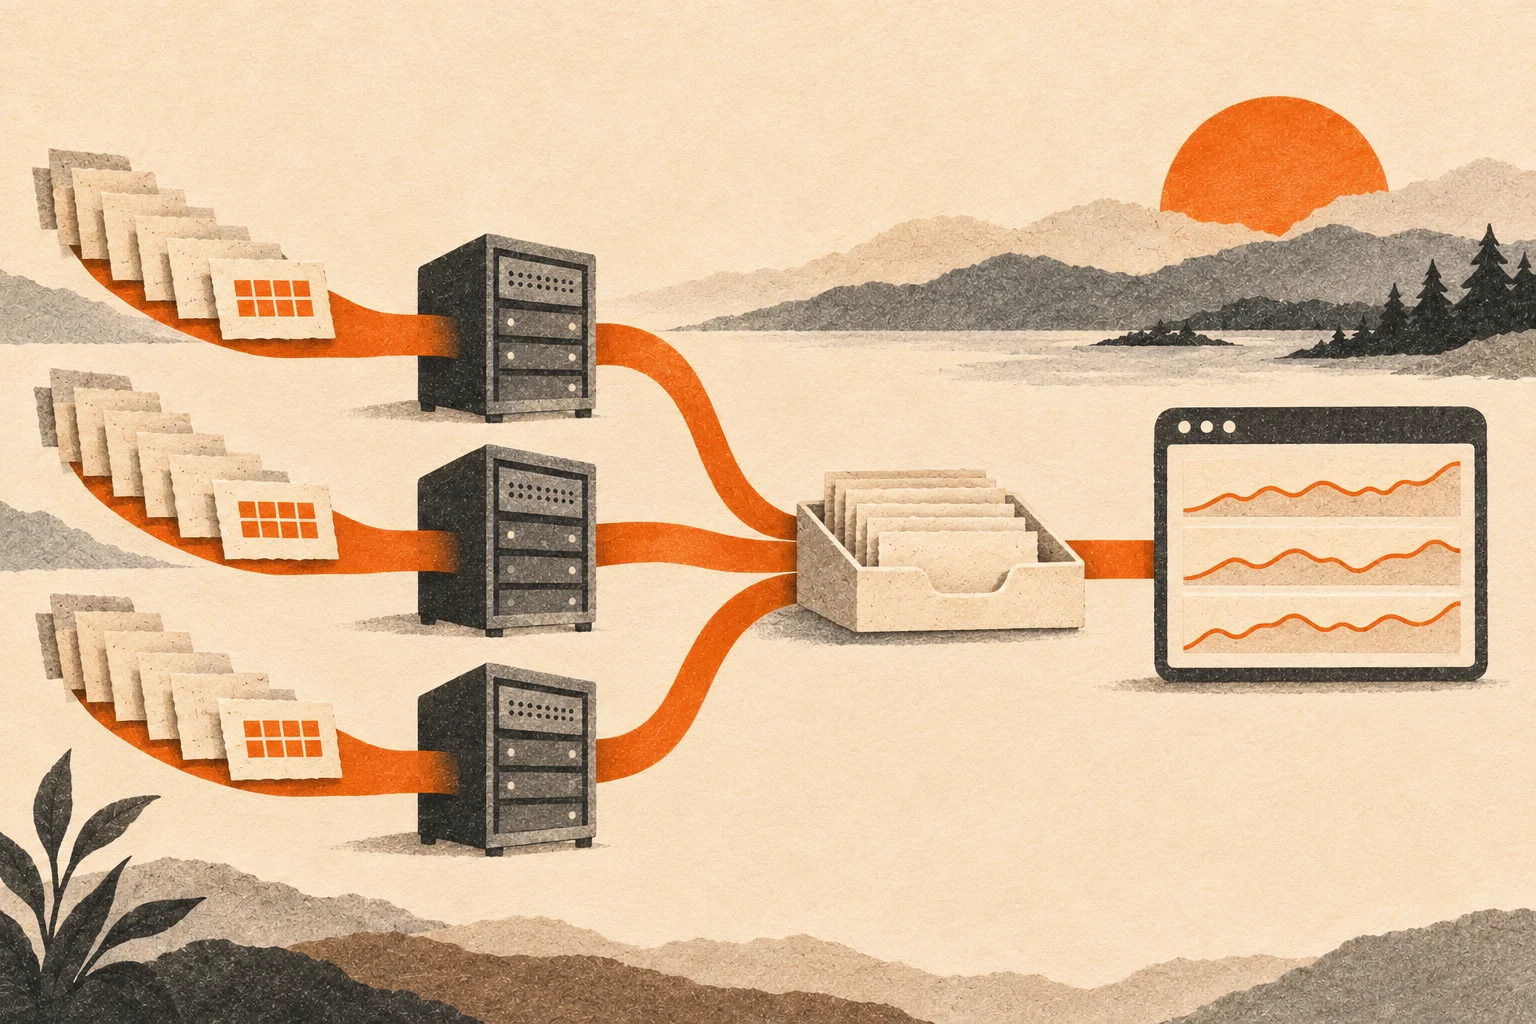
Our P2Pool dashboard starts with our own Monero node and three separate observer stacks. Main, Mini and Nano each supply statistics, shares and found blocks. A small dedicated Python service collects their responses, validates selected fields and serves a cached JSON statistics snapshot to browsers. Expanding a payout row triggers a separate request that checks every output against the recorded reward.
The distinction matters because these numbers describe different things. Sidechain shares record mining work. Found blocks record Monero rewards. Output lists describe how those rewards were divided. Keeping those records separate lets us show activity without presenting every share as a payment.
Our dashboard introduction covers the interface. Here is how the collection path works underneath it.
Three observers, one Monero blockchain
Each sidechain has its own P2Pool process, indexer and API. PostgreSQL hosts separate databases, so Main records cannot accidentally become Mini or Nano history. Persistent volumes retain the indexed data across container restarts.
The observers connect to peers on their respective sidechains. Our Monero node supplies blockchain information through RPC and event notifications through ZMQ. RPC provides requested data, while notifications help the observers react to new activity. The indexers turn that observed activity into records their APIs can query.
These services run without configured miners or payout wallets. Observing a chain does not contribute hashrate. P2Pool's upstream documentation explains how eligible shares participate in direct block reward payouts.
Private transport to the collector
The dashboard reaches our observer APIs through SSH forwarding. On the web host, Main, Mini and Nano appear at loopback ports 28801, 28802 and 28803. The Python service builds its upstream URLs from those local addresses, with environment overrides available for configuration.
Dedicated transport keys have restricted forwarding permissions, pinned host keys and disabled interactive access. The browser never needs these connections. It talks to the dashboard's own origin.
Public P2Pool Observer URLs remain in share and block links for manual exploration. They are navigation destinations. Our statistics collector has no automatic fallback to their APIs, so an internal failure remains visible instead of silently changing the data source.
Nine requests per collection
For each chain, the collector requests three endpoints:
| Endpoint | Purpose |
|---|---|
/api/pool_info |
Difficulty, window counts, effort and chain tips |
/api/shares?limit=60 |
Recent sidechain shares |
/api/found_blocks?limit=60 |
Recent Monero blocks found by that sidechain |
A ThreadPoolExecutor runs the nine requests with up to nine workers. Each request uses a 12-second timeout and reads at most 2,000,001 bytes. That extra byte detects responses exceeding the 2,000,000-byte limit, which are rejected before normalization.
After collecting the results, the service updates its shared snapshot under a lock. It then sleeps for 30 seconds. Consequently, the collection interval includes request duration plus that sleep. It is not an exact 30-second schedule.
Visitors request /api/stats, which serializes the cached snapshot. Opening more dashboard tabs does not trigger more background observer collections.
The snapshot is deliberately smaller than the upstream responses. Dropping unused fields reduces what the public endpoint exposes and gives the frontend a consistent structure. Each chain retains independent feed status, so a failed Nano request need not erase healthy Main readings. However, the collector publishes the batch after its requests finish. The shared snapshot is a collection result, not a guarantee that all nine sources describe precisely the same instant.
Converting responses into statistics
Normalization retains an explicit set of fields. Share entries keep their height, timestamp, difficulty and template identifier. Found blocks keep their Monero height, timestamp, reward, output count and block identifier. Identifiers must contain exactly 64 lowercase hexadecimal characters.
The numeric validator rejects booleans, negative values, nonnumeric values and nonfinite numbers. Pool statistics also require a nonzero consensus block interval. Estimated hashrate is calculated as:
hashrate_hps = sidechain_difficulty / consensus_block_time_seconds
For example, difficulty 250,000,000 and a ten-second target produce 25,000,000 hashes per second, or 25 MH/s. This is a difficulty-derived estimate, not a measurement collected from individual mining machines.
Miner, share and uncle counts describe the current payout window. Effort comes from the observer's current-effort field. It does not predict when the next block will arrive.
Checking individual payouts

Selecting a payout count requests /api/payouts/{chain}/{block-hash}. The server first checks that the hash belongs to that chain's recently cached found blocks. Arbitrary hashes cannot trigger unrestricted historical queries.
For an accepted block, the server requests /api/block_by_id/{block-hash}/coinbase from our observer. It rejects empty lists and lists exceeding 3,000 outputs. Each output must have an integer index and integer atomic amount.
After sorting, indices must match the complete sequence from zero through the final output. The output count must equal the block's recorded count. Finally, Python integer arithmetic checks:
sum(output_amounts_atomic) == recorded_block_reward_atomic
Only verified lists reach the expanded ledger. Responses retain indices and amounts while discarding miner addresses. A mismatch produces an error and retry option, rather than a partial list presented as complete.
Verified details are cached for five minutes, with a 180-entry bound and at most three concurrent upstream payout requests. One XMR equals 1,000,000,000,000 atomic units. Validation happens before conversion into the browser's displayed XMR amounts.
Fresh responses can contain old observations
Every feed records its last successful fetched_at timestamp. If fetching or normalization fails, the collector retains its previous data and timestamp, then attaches an error. Missing information never becomes a fabricated zero.
The frontend considers a feed fresh only when data exists, no error is recorded and its fetch age is below 120 seconds. Separately, the observer's sidechain tip must be younger than 300 seconds. A successful HTTP response therefore cannot conceal an observer that has stopped advancing.
The browser requests statistics every 30 seconds and redraws age indicators every ten seconds. A pending-request guard prevents overlapping statistics requests. Connection failures preserve the displayed snapshot with warnings.
What the charts actually represent
The share strip shows up to 60 observed shares, oldest first. The reward chart uses up to 30 found blocks. Its total covers those displayed blocks, not a rolling day. The ledger shows up to 20 blocks, and output counts do not identify unique people.
Confirmations use the observer's Monero height minus the block height plus one, clamped at zero. They become unavailable when observer freshness or browser connectivity fails. Recent blocks can still be reorganized.
Our recorded history grows as observers collect data. A short ledger reflects available local records. Reading it alongside freshness indicators gives the numbers their necessary context: which chain supplied them, what they measure and whether the observation is still current.